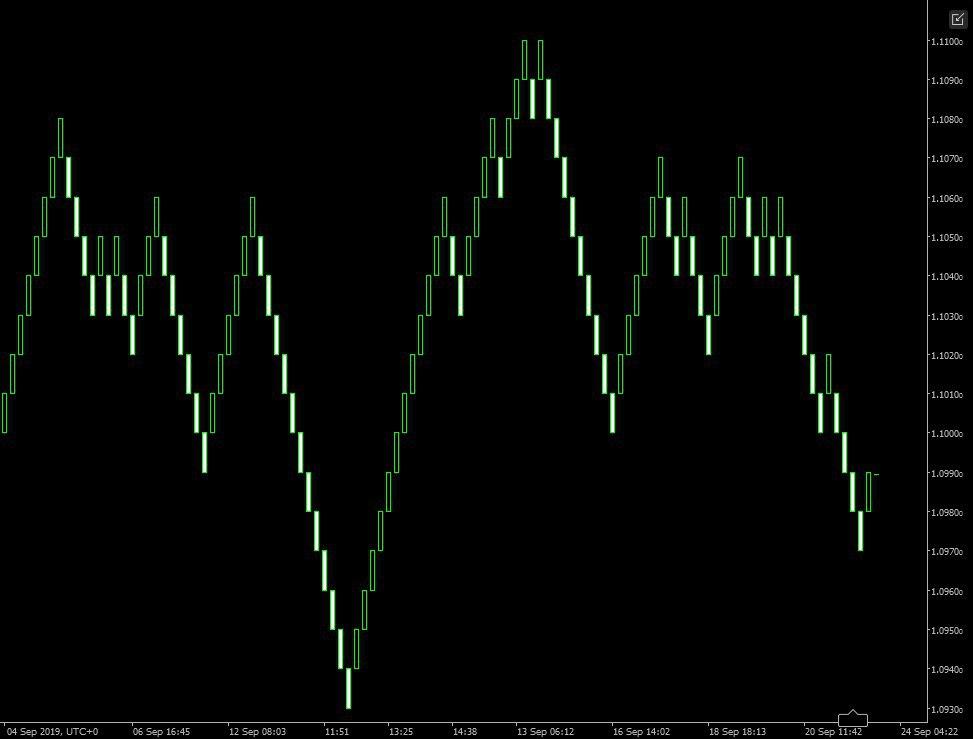
Japanese technical analysis suggested presenting the value of a product in a special way using the Renko chart. Candlestick charts invented in Japan became the de facto standard for displaying price movements in all popular trading platforms. For 200 years, their patterns have been generating steady profits despite high-frequency trading (HFT) and other technical innovations. However, they also have worthy alternatives, such as Renko price bars. Find out how the best Renko trading system works and what things you need to keep in mind when using it.
The Trading Strategy Based on Renko Charts
The central element of the trading strategy based on Renko is Standard Deviation, which determines the moment when the price begins to return to its “central” value. In fact, this will be an entry signal – as soon as the deviation unfolds to the average, you should open a deal according to the trend. You should do additional smoothing of random fluctuations in the graphs using RSI.
The Take Profit and Stop Loss values are set depending on the asset or in the standard way after the last local highs/lows, which are clearly visible on Renko. Close the position when the return signal appears. Experienced traders can try to average over the new signal if the correction continues. The Renko chart was primarily designed to simplify the visual analysis of the market.
The Advantages and Disadvantages of Renko
Like any other market analysis technique, the Renko chart has advantages and disadvantages that must be taken into account using similar non-standard charts. Let’s start with Renko benefits.
- Renko, like other charts that do not take into account the time factor, is based on closing prices (Close) and is clearly more informative – symmetric candles allow you to see the “real” trend and strong support/resistance levels.
- There is practically no market “noise” on the charts, and thus, local highs/lows and trend reversal points are more clearly defined on Renko.
- If the Renko chart changes color, it will be a signal to buy or sell. Their appearance can be used to confirm other indicators, especially moving averages with their delay.
What about the disadvantages? Despite the obvious advantages of Renko, there are several problems that make it difficult to interpret them correctly:
- Charts remove not only noise but also volatility. For the formation of the Renko bar, a certain time is needed from several minutes to hours. The display goes only after the candle closes, which may cause some concern for novice traders.
- At the same time, when there is a flat, there may be impulses and bounces from the borders of the range, which can be easily traded according to scalping strategies. Such situations are immediately visible on the candlestick chart, so use them as an addition to Renko.
Despite the shortcomings, the Renko chart continues to be one of the most effective tools for determining trends, reversals, and strong price levels on any financial asset. Moreover, traders admit that the best results were obtained on intraday trading and transactions lasting at least 2-3 hours.
